
The brief’s key findings are:
- When the employer cost for employer-sponsored health insurance (ESHI) rises, it slows wage growth and erodes Social Security’s tax base.
- Both these effects were evident from 1996-2005, but the situation stabilized during 2005-2019.
- Why did the ESHI-to-compensation ratio stabilize?
- During both periods, the major driver was the general rise in national health costs.
- From 2005-2019, this impact was largely offset by less ESHI participation by lower earners and less demand for family plans.
- Going forward, rising health costs could again push up the ESHI-to-compensation ratio, unless the factors that have been offsetting this growth continue.
Introduction
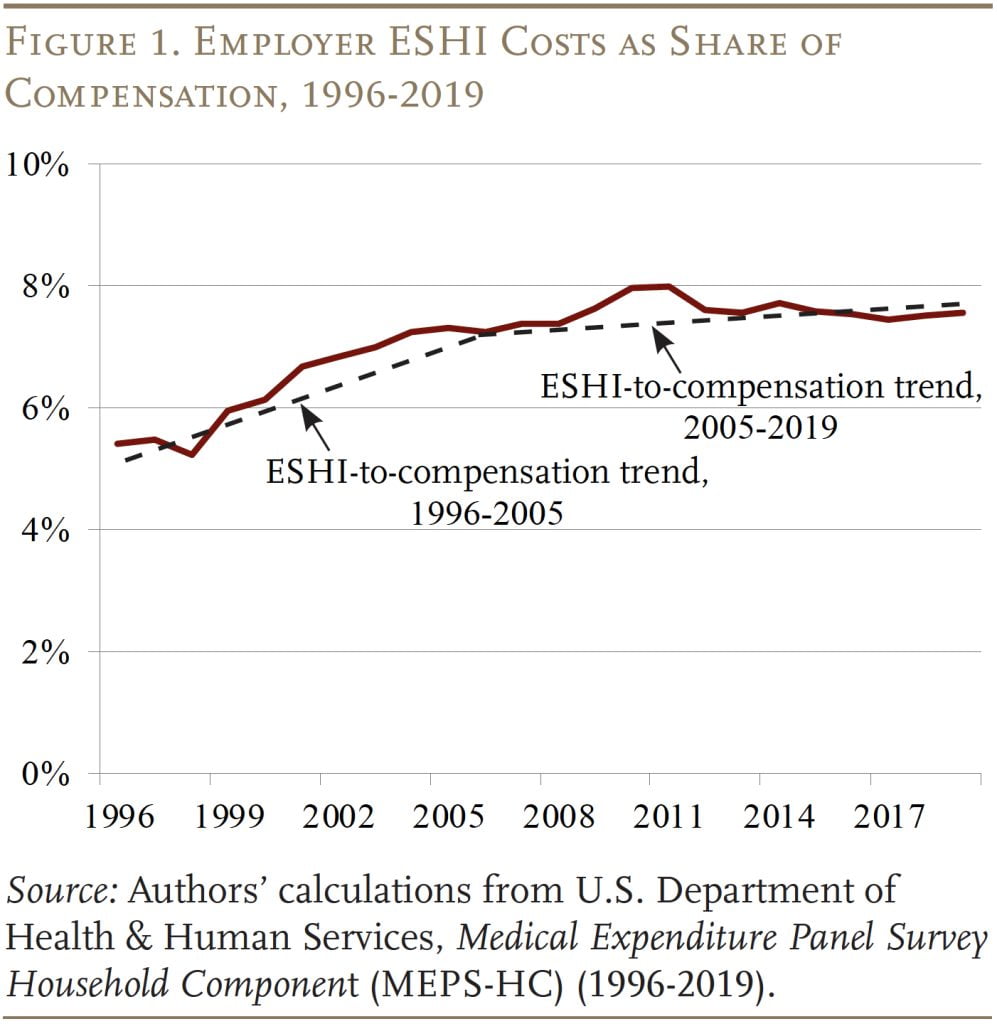
The rising cost of employer contributions to employer-sponsored health insurance (ESHI) can slow wage growth and erode the Social Security wage base. Both these effects were evident in the decades before 2005, as ESHI increased as a share of compensation. Fortunately, the ratio of ESHI contributions to compensation plateaued after 2005, stabilizing wages and halting the erosion of the share of compensation subject to Social Security’s payroll tax. The question is whether this stabilization is temporary or permanent.
This brief, which is based on a recent paper, uses the Medical Expenditure Panel Survey (MEPS) to determine why ESHI contributions rose as a share of compensation prior to 2005 and why this ratio stabilized in recent years. These findings are then used to project possible ratios of ESHI to compensation over the next decade.
The discussion proceeds as follows. The first section identifies the major factors that could impact the ratio of ESHI to compensation. The second section describes the MEPS data. The third decomposes the role of the various factors in the increase and subsequent stabilization of the ESHI-to-compensation ratio. The fourth section uses these results and projections of National Health Expenditures (NHE) from the Centers for Medicare & Medicaid Services (CMS) to estimate what the ratio may look like over the next 10 years.
The final section concludes that the growth in the health spending-to-GDP ratio was the major driver of the ESHI-to-compensation ratio both before and after 2005, but after 2005 this impact was largely offset by the decline in participation in ESHI plans among lower earners and the decline in demand for family health plans. Looking forward, CMS projects that the NHE/GDP ratio will rise from 17.6 percent in 2019 to 19.6 percent in 2031. If nothing else changes, ESHI as a share of compensation will increase as well. But, if ESHI participation and demand for family plans decline from 2019-2031 as they have from 2005-2019, the ESHI-to-compensation ratio should remain stable.
Major Drivers of ESHI Trends
Economists generally assume that the costs of employer benefits, such as health insurance, are passed onto the employee through slower wage growth. As a result, the rising cost of ESHI has been identified as a major contributor to wage stagnation and the major reason for the decline in the share of compensation subject to the Social Security payroll tax. The good news is that between 2005 and 2019 – with a temporary spike during the Great Recession – the ratio of ESHI to compensation stabilized (see Figure 1).
Prior research identifies three major factors that drive the cost of ESHI as a share of compensation: 1) general trends in healthcare spending; 2) whether those signing up are high- or low-compensated employees; and 3) the type of coverage selected – family vs. individual plan.
Overall Healthcare Costs
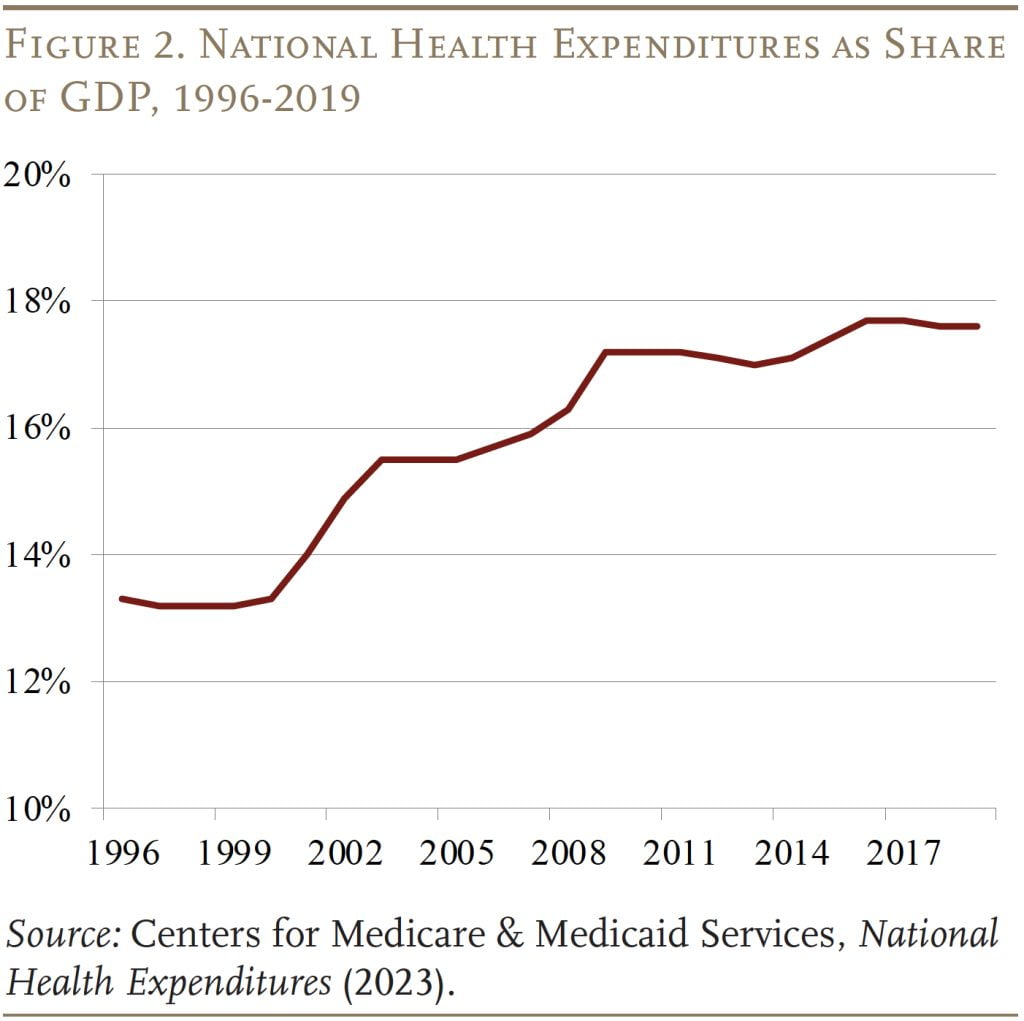
General trends in healthcare spending are, not surprisingly, an important driver for trends in ESHI. Reflecting both increases in prices and utilization, national health expenditures increased from about 13 percent of GDP in the mid-1990s to around 17 percent of GDP in 2009, before plateauing through 2019 (see Figure 2).
Characteristics of ESHI Participants
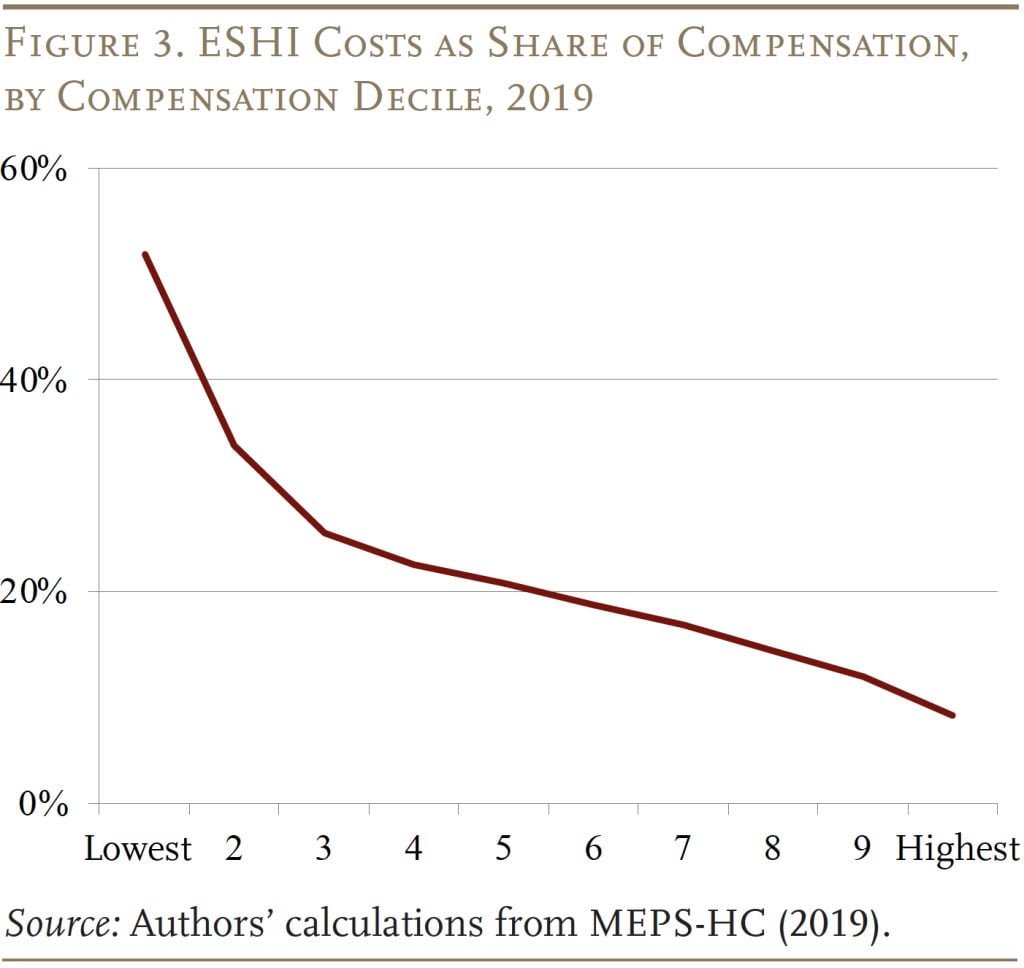
Another determinant of trends in ESHI costs is the makeup of the participants. Since health insurance is a larger share of compensation for lower earners than for higher earners (see Figure 3), a decline in participation among lower earners decreases the employer’s overall ratio of ESHI costs to compensation.
Indeed, participation among lower earners has declined – driven almost entirely by a decline in employee take-up and not by a decline in firms offering health insurance. The drop in take-up can be attributed to a number of factors. First, rising healthcare costs make it harder for all workers – but particularly lower-wage workers – to cover the employee portion of health insurance premiums. Second, the share of premiums paid by employers declined, further raising premium costs. Third, the expansion of Medicaid under the Affordable Care Act made it easier for low-wage workers to opt for the public program.
All these developments encouraged lower earners to opt out of ESHI and shifted the distribution of participation to higher earners, reducing ESHI costs as a percentage of compensation.
Family vs. Individual Coverage
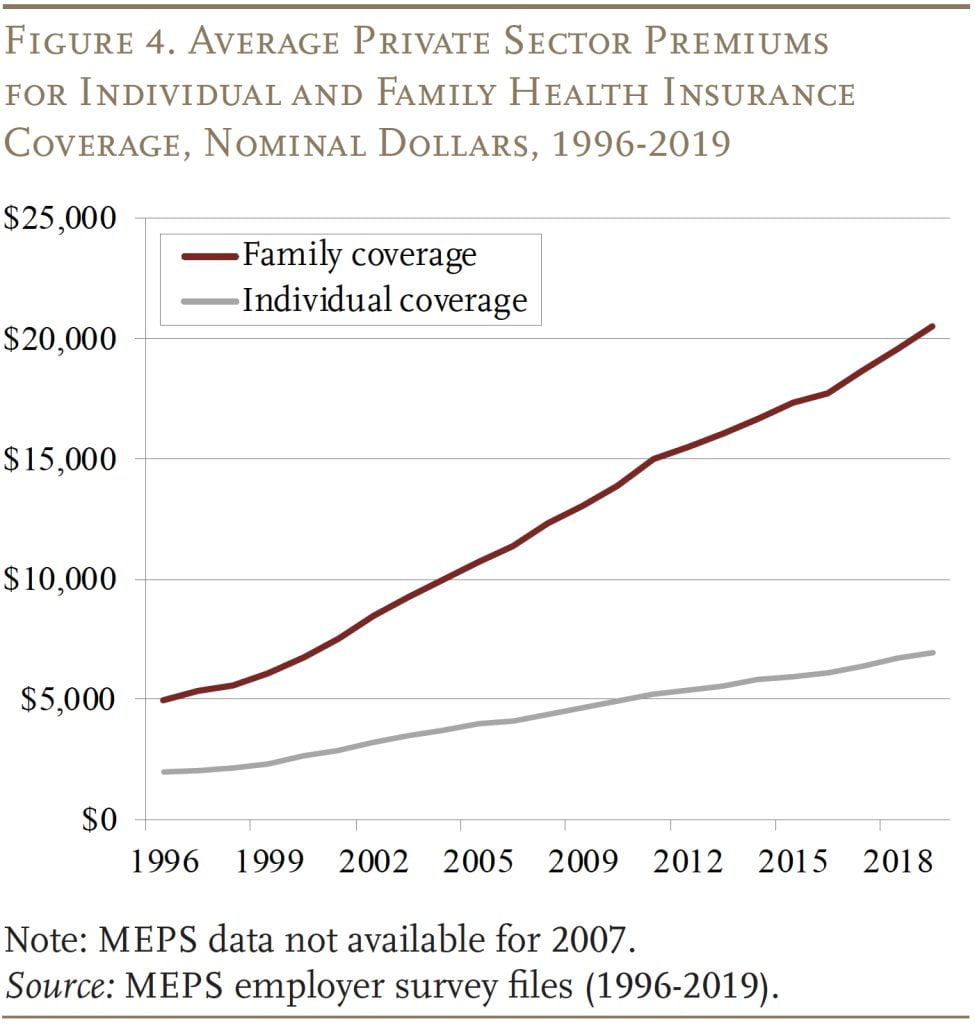
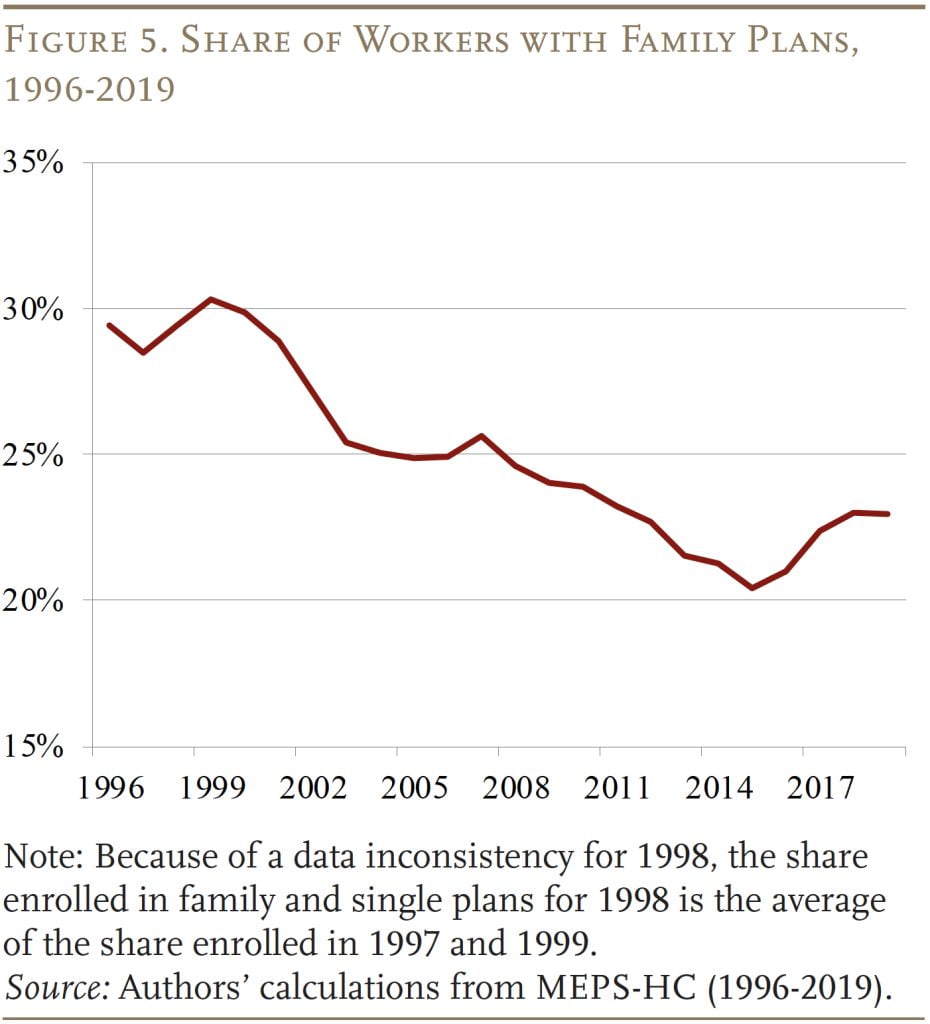
The final factor that affects the ratio of ESHI to compensation is the share of participants that opt for family plans as opposed to individual plans. Family plans are substantially more expensive, and their costs have grown at a faster pace (see Figure 4).
In response, the share of workers opting for family coverage has declined at a steady clip in recent decades (see Figure 5), placing downward pressure on the growth of ESHI costs as a percentage of compensation. The characteristics of who is opting for family coverage also matter for ESHI costs. If most of the decline in family coverage is driven by lower-wage workers, then ESHI costs should decline substantially since family plans represent a particularly large portion of compensation for these workers.
The key questions are: 1) the extent to which each of these factors contributed to the increase in the share of compensation paid as ESHI prior to 2005 and then to the stabilization of this share after 2005; and 2) whether this ratio will remain stable going forward.
Data
The data for the analysis come from the Department of Health and Human Services’ Medical Expenditure Panel Survey (MEPS). The MEPS is a two-year panel survey that contains information on households, medical providers, and types and costs of health insurance offered by employers. Our analysis uses microdata from the 1996-2019 household survey files and the aggregate data from the employer survey.
Respondents surveyed in the MEPS are interviewed five times over two calendar years. We link respondents across interview waves and include only those who are present for all interviews. Each respondent is counted once each year, so will appear twice in the data. The final sample consists of 274,163 workers for the period 1996-2019. This analysis stops in 2019 because COVID disrupted many pre-existing trends in 2020.
The MEPS data – as well as national health expenditure data – are used to quantify how much each of the factors – overall healthcare costs, the compensation distribution of ESHI participants, and family vs. single plan enrollment – contributed to trends in the ESHI-to-compensation ratio.
Historical Analysis: 1996-2005 and 2005-2019
The first step in quantifying how much each factor contributed to trends in the ESHI-to-compensation ratio (ESHI/Comp) is to estimate the following OLS regression for the two periods: 1996-2005 and 2005-2019.
ESHI/Comp = ƒ(NHE/GDP, HighComp, LowComp, FamilyPlan, (HighComp*FamilyPlan), Controls)
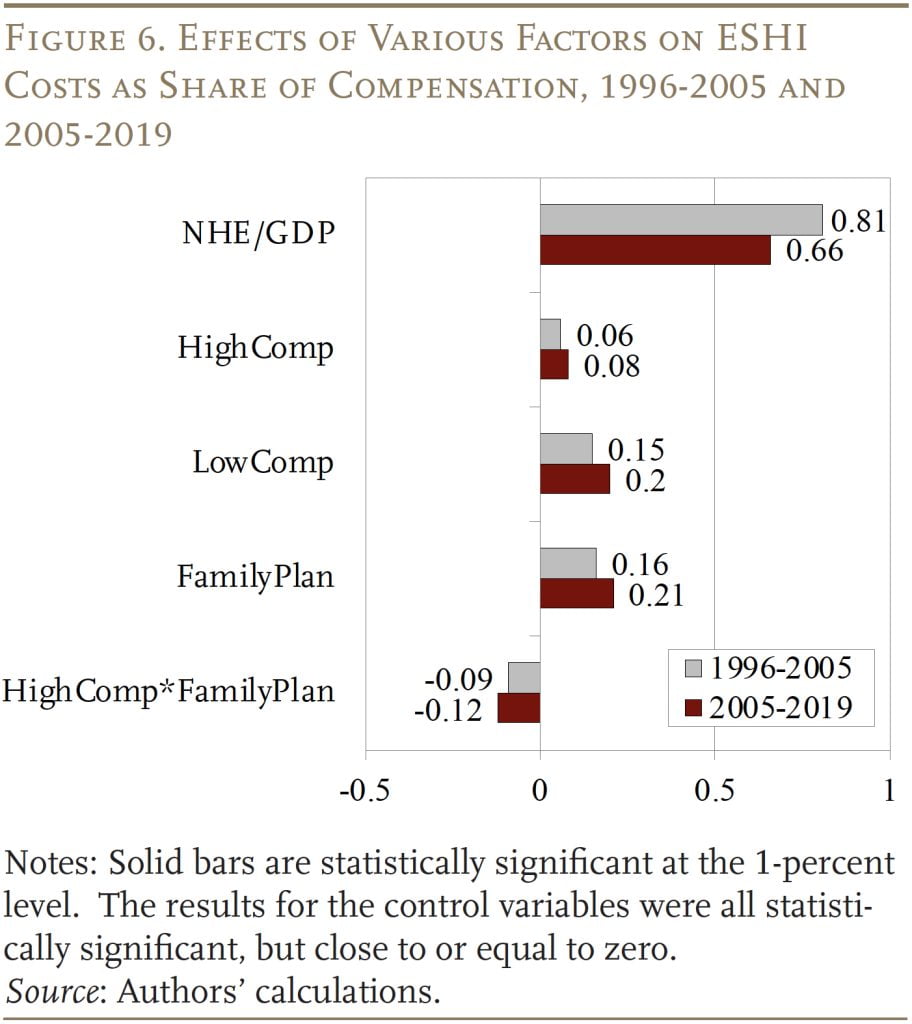
In terms of the explanatory variables, NHE/GDP represents aggregate annual national health expenditures as a percentage of GDP, HighComp is an indicator if a worker with ESHI is in the high compensation deciles (5-10) and LowComp is an indicator if the worker is in the low compensation deciles (1-4), and FamilyPlan indicates whether the worker has a family plan. The equation also includes an interaction term of high-compensation worker and family plan, which is important because, as discussed above, ESHI costs would decline much more if most of the shift away from family plans is driven by lower-compensated workers. Finally, the equation includes various controls, such as working in the public sector, being in a union, being near retirement, marital status, and gender.
The results are as expected (see Figure 6). As NHE as a share of GDP increases, so does the ratio of ESHI to compensation, although the effect is smaller between 2005-2019 as other factors grow in importance. Increased participation has a smaller effect on the ratio if it occurs among higher-compensated workers than lower-compensated workers. This pattern is consistent with the fact that ESHI represents a smaller share of the compensation of higher earners. The higher the share of workers enrolled in a family plan, the higher ESHI costs are as a percentage of contributions, since family plans are more expensive. But, if a larger share of those with a family plan are higher-compensated workers, average ESHI costs will not go up by as much. All the coefficients are consistent across the two periods examined.
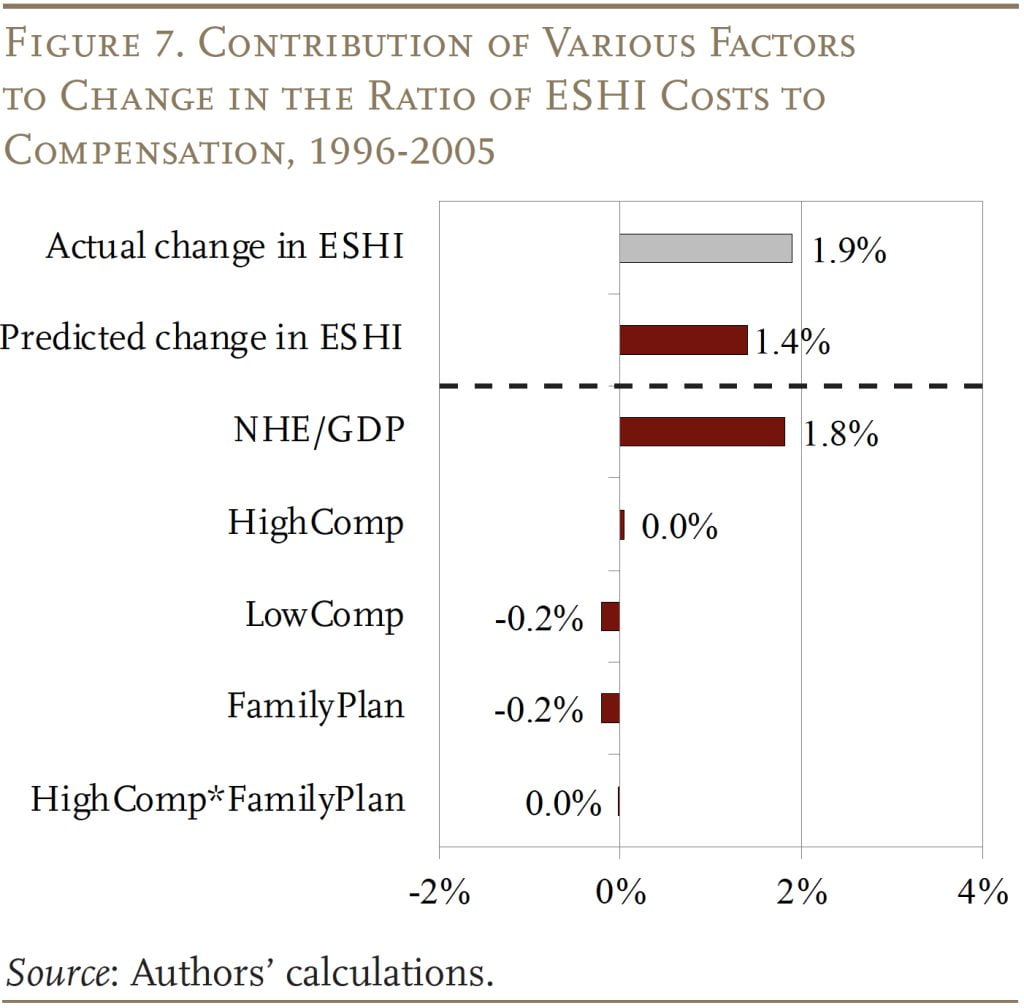
The results from these OLS equations constitute the basis for determining the contribution of each factor to the change in the ratio of ESHI to compensation over each of the two periods. The exercise involves multiplying the coefficients from the regressions by the change in each factor over the period. For example, to determine the contribution of nationwide health expenditures to ESHI trends during 1996-2005, the change in NHE expenditures as a percentage of GDP over the period (0.022) is multiplied by the coefficient for NHE/GDP (0.81) to get 1.8 percentage points (see Figure 7). But similar calculations also show that pushing in the other direction are: 1) a decline in the share of lower earners who have employer health insurance; and 2) a decline in the share of workers enrolled in family plans. These two trends each reduced ESHI as a percentage of compensation by 0.2 percentage points. On net, the factors combined explain 1.4 of the 1.9-percentage-point growth in ESHI as a percentage of compensation over the 1996-2005 period.
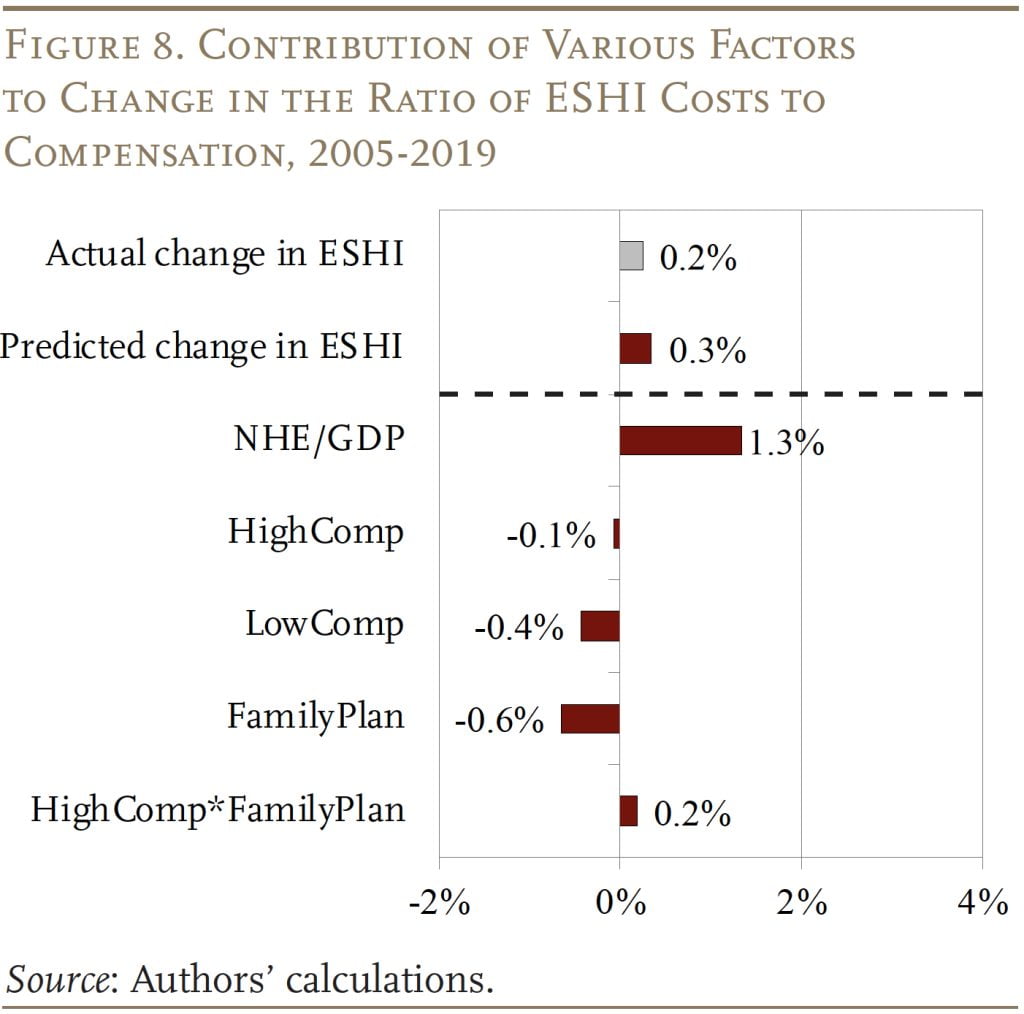
The exercise is repeated for the period 2005-2019, when ESHI as a percentage of compensation slowed (see Figure 8). Although growth slowed, NHE/GDP still increased ESHI as a percentage of compensation by 1.3 percentage points. Once again, the continued decline in lower earners participating in employer health insurance pushed down ESHI costs. The effect during this period, however, is much larger, reducing the ESHI-to-compensation ratio by 0.4 percentage points. The share of higher earners also decreased slightly, pushing the ratio of ESHI to compensation down by 0.1 percentage points. The decline in family plan enrollment had competing effects, because higher earners also opted out of family plans during this period; the combined effect was -0.4 percentage points. On net, the impact of the various factors predicted ESHI as a percentage of compensation grew by only 0.3 percentage points, almost identical to the 0.2-percentage-point growth observed over the 2005-2019 period.
In short, three major factors – aggregate health expenditures, distribution of ESHI participation, and family plan enrollment – can explain both the growth in ESHI as a share of compensation between 1996-2005 as well as the slowdown between 2005-2019. The biggest driver of the ESHI-to-compensation ratio is NHE as a percentage of GDP. But fewer lower earners with ESHI and a decline in family plan participation has placed increasing downward pressure on the ratio.
Outlook for the Future: 2019-2031
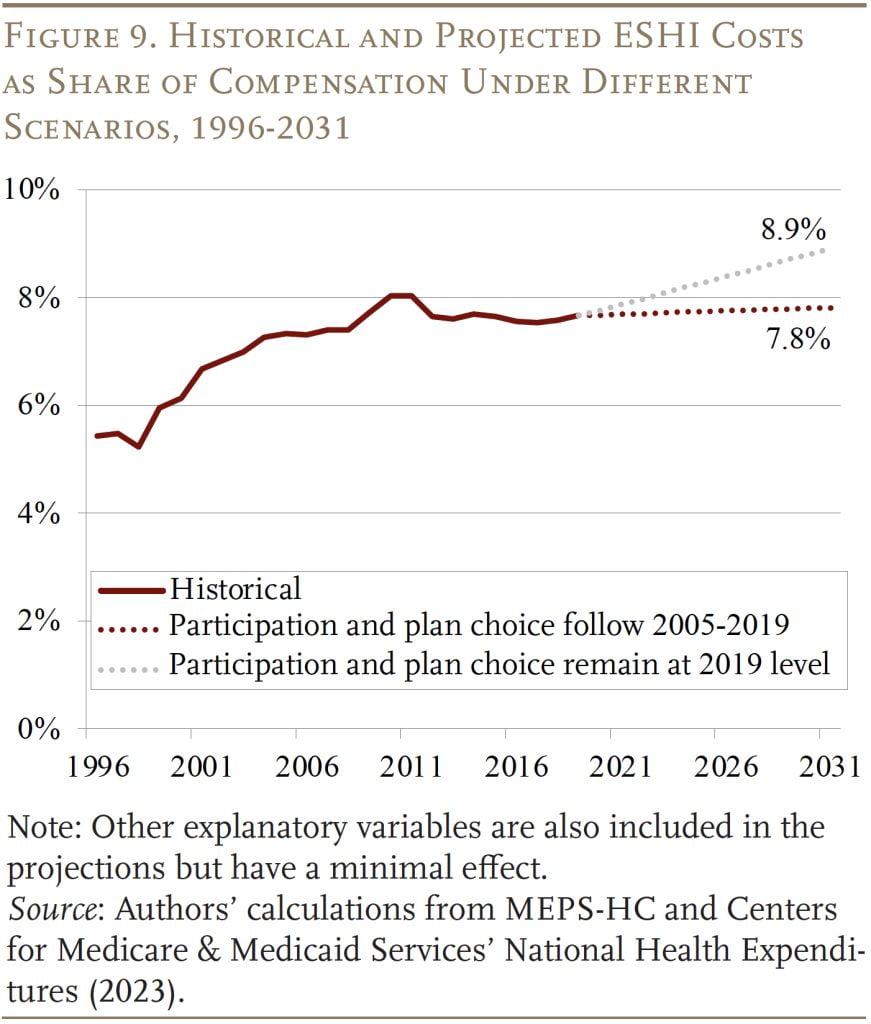
Projecting the ESHI-to-compensation ratio in 2031 requires projections for each of the contributing factors. For the most important factor, NHE as a share of GDP, CMS provides projections that incorporate the most recent trends and potential legislative impacts. These estimates show that the NHE-to-GDP ratio will increase from 17.6 percent in 2019 to 19.6 percent in 2031. For the other two major factors – ESHI participation and demand for family plans – our baseline assumption is that both will continue to decline at the rate observed between 2005-2019.
The predicted values for participation and plan type are determined simply by multiplying the coefficient estimate (average annual change) from the equation by 12 (number of years from 2019 to 2031) and adding it to the level in 2019. For example, the share of workers with a family plan declined by an average of 0.2 percentage points per year over the period 2005-2019. If this trend continues, only 21.7 percent of workers would have a family plan in 2031. Similar projections are made for all the factors that could affect ESHI as a percentage of compensation. An alternative assumption is that ESHI participation and demand for family plans remain at 2019 levels.
The projections under the two scenarios are shown in Figure 9. If recent declines in ESHI participation among lower-compensated workers and family plans continue until 2031, the ratio of ESHI to compensation will stabilize at 7.8 percent, largely cancelling out the effect of rising NHE/GDP in future years. In contrast, if recent trends have played out so that the declines in ESHI participation and family plan coverage remain at 2019 levels, the ratio of ESHI to compensation could increase to 8.9 percent.
Conclusion
The rising cost of employer contributions to employee health insurance was a major reason for wage stagnation and the erosion of the Social Security wage base. Both these effects were evident in the decades before 2005, as ESHI increased as a share of compensation. Fortunately, the ratio of ESHI contributions to compensation plateaued after 2005, stabilizing wages and halting the erosion of the share of labor compensation subject to Social Security’s taxable base.
The growth in NHE was the major driver of the ESHI-to-compensation ratio both before and after 2005, but after 2005 this impact was largely offset by the decline in participation among lower earners and the decline in demand for family plans. Looking forward, CMS projects that NHE as a share of GDP will grow from 17.6 percent in 2019 to 19.6 percent in 2031. If nothing else changes, ESHI as a share of compensation will increase as well. But, if ESHI participation and demand for family plans continue to decline as they have in recent years, these two factors should offset the growth in healthcare expenditures and the ratio of ESHI to compensation should remain stable.
References
Agency for Health Research and Quality. Medical Expenditure Panel Survey, 1996-2019. Washington, DC: U.S. Department of Health and Human Services.
Burtless, Gary and Sveta Milusheva. 2013. “Effects of Employer-Sponsored Health Insurance Costs on Social Security Taxable Wages.” Social Security Bulletin 73(1): 83-108.
Case, Anne and Angus Deaton. 2020. Deaths of Despair and the Future of Capitalism. Princeton, NJ: Princeton University Press.
Centers for Medicare & Medicaid Services. 2023. “National Health Expenditure Data.” Baltimore, MD: Research, Statistics, Data & Systems.
Chen, Anqi, Alicia H. Munnell, and Diana Horvath. 2023. “How Will Employer Health Insurance Affect Wages and Social Security Finances?” Working Paper 2023-12. Chestnut Hill, MA: Center for Retirement Research at Boston College.
Chernew, Michael, David M. Cutler, and Patricia Seliger Keenan. 2005. “Increasing Health Insurance Costs and the Decline in Insurance Coverage.” Health Services Research 40(4): 1021-1039.
Cooper, Philip F. and Barbara Steinberg Schone. 1997. “More Offers, Fewer Takers for Employment-Based Health Insurance: 1987 and 1996.” Health Affairs 16(6): 142-149.
Cutler, David M. 2002. “Equality, Efficiency, and Market Fundamentals: The Dynamics of International Medical-Care Reform.” Journal of Economic Literature 40(3): 881-906.
Farber, H. S. and H. Levy. 2000. “Recent Trends in Employer-Sponsored Health Insurance Coverage: are Bad Jobs Getting Worse?” Journal Health Economics 19(1): 93-119.
Fronstin, Paul and S. C. Snider. 1996. “An Examination of the Decline in Employment-Based Health Insurance Between 1988 and 1993.” Inquiry 33(4): 317-325.
Gabel, Jon, Larry Levitt, Erin Holve, Jeremy Pickreign, Heidi Whitmore, Kelley Dhont, Samantha Hawkins, and Diane Rowland. 2002. “Job-Based Health Benefits in 2002: Some Important Trends.” Health Affairs 21(5): 143-151.
Glied, Sherry and Kathrine Jack. 2003. “Macroeconomic Conditions, Health Care Costs, and the Distribution of Health Insurance.” Working Paper 10029. Cambridge, MA: National Bureau of Economic Research.
Groshen, Erica L. and Harry J. Holzer. 2019. “Improving Employment and Earnings in Twenty-First Century Labor Markets: An Introduction.” The Russell Sage Foundation Journal of the Social Sciences 5(5): 1-19.
Gruber, Jonathan and Robin McKnight. 2003. “Why Did Employee Health Insurance Contributions Rise?” Journal of Health Economics 22: 1085-1104.
Kaiser Family Foundation. 2023. “Status of State Medicaid Decisions: Interactive Map.” San Francisco, CA.
Kronick, R. and T. Gilmer. 1999. “Explaining the Decline in Health Insurance Coverage.” Health Affairs 18(2): 30-47.